Snap Share, Air Yards & More: 7 Stats That Matter For NFL Prop Bets This Week
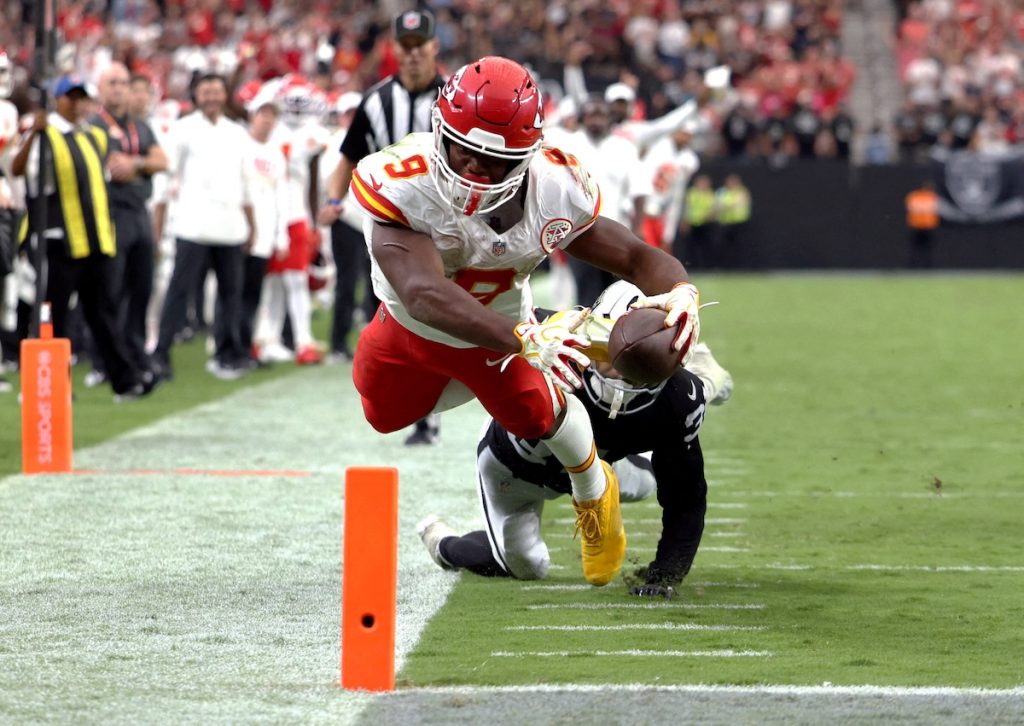
Betting on NFL player props requires more knowledge than baseline stats and recent box scores. A wide receiver averaging 80 yards per game isn’t an automatic Over when their line is set at 64.5. Similarly, a running back coming off a 100-yard performance doesn’t mean they’ll match that the next week.
A strong NFL player prop betting strategy starts with understanding opportunity rather than following previous results. Snap shares, targets, red-zone usage, pace, and matchups predict better than previous yardage or touchdown totals.
7 Stats That NFL Prop Bettors Should Know: Why Usage Matters More Than Box Scores
NFL player prop research should start with opportunity, not past results. Here’s a list of some results and opportunity metrics for NFL player props:
Results:
- Yardage totals
- Pass completions
- Receptions
- Touchdowns
Opportunities:
- Snaps
- Pass attempts
- Carries
- Targets
- Routes
- Red-zone opportunities
If George Pickens had four receptions for 100 yards on four targets and Ja’Marr Chase had three receptions for 55 yards on 11 targets in Week 1, Pickens enters Week 2 with the better results. Chase enters Week 2 with more opportunity.
In this scenario, the box score is misleading because of efficiency. Past results shouldn’t dictate future projections.
Identifying repeatable opportunities rather than chasing game logs is one of the biggest keys to betting NFL player props.
The following seven NFL player prop stats can help bettors evaluate opportunity, role, game environment, and overall efficiency before comparing their projections to sportsbook player prop lines.
1. Snap Share
Playing time is the first step toward opportunity in the NFL. If a player isn’t on the field, they can’t record stats.
Snap share is the percentage of a team’s offensive plays a specific player is on the field. It’s useful for identifying a variety of situations, including:
- Running back committee roles
- Depth-chart changes
- Rookie breakouts
- Injury replacements & players returning
Snap trends can often reveal changes in an offense before production shows up. If a running back’s snap share increases from 35% to 45% to 55% over three weeks, they’re likely to produce more as they land more snaps.
NFL snap shares are only the first indicator of opportunity. They don’t automatically equate to usage.
Some tight ends are used specifically as blockers and could see plenty of snaps without ever seeing a target. Third-down running backs will play plenty of snaps, but they’ll be limited in terms of rushing because of the situation.
Once we determine snap share, we need to move on to opportunity share.
2. Target Share, Carry Share, & Opportunity
Volume matters, but a team’s opportunity share adds context. Ultimately, opportunity share allows us to project future volume based on the expected pace of that matchup.
Quarterback opportunities come through dropbacks and pass attempts. They could also see carry share, which shows opportunities for running backs, along with touch share. The top opportunities for wide receivers come via target share.
Opportunity share allows us to monitor major roles in an offense. We can also find one-game outliers by teams with unusually high play volume that week.
For example, a running back who handles 15 of 20 backfield touches boasts a 75% touch share. A different running back could handle the same 15 touches, but in a backfield with 30 touches overall, that's a 50% touch share. The first RB is more of a workhorse, although they had the same number of touches.
Volume wins player props, but opportunity share identifies who will get that volume.
3. Route Participation & Targets Per Route Run
One of the most overlooked predictive metrics is route participation. This is how often a receiver runs a route when his team calls a pass play.
Snaps alone can mislead projections for NFL receiving props. Instead, we need to find how often those players run routes. Running backs and tight ends often block or release late on pass plays, so a snap on a pass play doesn’t automatically mean a receiving opportunity.
We can also use route participation to evaluate targets per route run (TPRR).
If Amon-Ra St. Brown and Chris Olave each receive five targets, but St. Brown runs 40 routes and Olave runs 20, the latter sees drastically more targets per route run.
We can identify soft lines by monitoring injuries or depth chart changes, and combining route participation with TPRR. This works best for receptions and receiving yards.
4. Air Yards & Average Depth of Target (aDOT)
Air yards and aDOT are two of the most overlooked stats when looking for NFL receiving props. First, let’s define them:
- Air yards - The distance the football travels toward a receiver before the catch/incompletion
- aDOT - Average distance at which the receiver is targeted
We can determine which props to look at based on the types of targets receivers are getting.
For example, Garrett Wilson and Tucker Kraft could both record eight targets in a game. Wilson could see 140 air yards (17.5 aDOT) while Kraft saw 40 air yards (5.0 aDOT).
In this situation, Wilson’s receiving yards and Kraft’s receptions have more value because of the type of targets they’re seeing. Higher aDOTs generally mean lower-percentage, more volatile targets.
Air yard share also helps us evaluate who’s seeing the most air-yard opportunities for any given team.
5. Red-Zone & Goal-Line Opportunities
Touchdown totals are misleading because touchdowns are generally high-variance and fluky results. They can fluctuate substantially, and NFL red-zone stats point to the opportunities that create touchdowns.
Rushing touchdowns generally come closer to the goal line. When projecting rushing touchdowns, check red zone and inside-the-10 carries, but goal-line carries are the most predictive metric.
Red zone opportunities matter for projecting receiving touchdowns, but goal-line opportunities aren’t quite as necessary. Red zone and inside-the-10 targets generally suffice for projecting receiving touchdowns.
It’s also important to find the players with the highest share of red zone work. Quarterbacks and running backs want the highest share of carries, specifically at the goal line, while wide receivers and tight ends want the higher target share.
Touchdowns are fluky stats, but scoring opportunities can be stable. If you consistently identify the opportunities, the touchdowns are likely to follow.
6. Pace & Expected Play Volume
Pace is one of the biggest keys to NFL player prop betting. The more plays that are run in a game, the more opportunities players have to record stats.
Arguably the most essential key to projecting play volume is neutral-situation pace. This is how quickly a team plays when the score isn't dictating a certain approach.
Teams will generally speed up or slow games down when they’re winning or losing. It’s crucial to know how teams will play when the score isn’t dictating a certain approach.
Two fast-paced offenses facing off can create drastically more offensive opportunities, while two slow-paced teams would create fewer.
Game totals and spreads should also be considered when projecting play volume. They can indicate how Vegas views the game and provide context for whether the score could get out of hand at any point.
7. Expected Points Added (EPA) & Success Rate
Before breaking down how to use these stats in your NFL prop betting strategy, let’s define them.
- EPA - a metric that measures how much a play increases or decreases a team’s expected points based on the game situation
- Success Rate - a metric that measures how often an offense gains a specific percentage of required yards on any given down
EPA and success rate are more advanced ways to determine an offense's or defense's efficiency. Both can be used for passing or rushing, and for offense or defense.
Use these with opportunity metrics, as they show how efficiently players contribute with those opportunities.
NFL Player Prop Research Checklist
These stats make it easy to create an overall checklist for your NFL player prop research.
- How often will he be on the field?
- How much of the team’s opportunity will he see?
- Is his receiving role real?
- What type of targets does he get?
- How many scoring opportunities does he get, and what type?
- How many opportunities will the game produce?
- How efficient is the matchup?
Overall, these stats will look at the player's role and opportunities, the game environment, and how efficient they should be.
Final Thoughts: Dive Into the Analytics to Find Value Props
No single stat should determine your bets. The entire process should guide your decisions.
Box scores show us what already happened throughout the season. The best NFL player prop research focuses on determining whether those players will continue to see those opportunities. Combining sustainable usage with game environment and matchup efficiency can help build better projections.
Your projection also needs to beat the sportsbook number. Determining a good spot doesn’t necessarily make a good bet if the sportsbook line is already inflated. Find the biggest discrepancies between your projections and the lines sportsbooks are offering.
-
Snap Share, Air Yards & More: 7 Stats That Matter For NFL Prop Bets This Week
-
How Does Underdog Rips Work? Buy, Sell and Trade Card Packs This [month]
-
Lamar Jackson Could Miss Multiple Games With Sprained Ankle
-

Sweet Sweeps Casino Kicks Off 3-Day Wizard Challenge: Get Up to 200 FS
-
NHL Anytime Goal Scorer Predictions Today: Best Bets for Oct. 6
-

MLB Home Run Props and Predictions Today: Top Player Props for Oct. 6