San Antonio Spurs @ Detroit Pistons Picks and Predictions - February 23rd 2026

7:00pm

San Antonio Spurs (62-20) make the trip to at Little Caesars Arena to match up with Detroit Pistons (60-22) on Tuesday, February 24, 2026 at 12:00 AM ET. The number starts with Pistons laying 1 and the total at 231.5. A tight spread usually puts extra weight on shot quality late.
With matching recent form, bettors need to lean on the matchup and the number. The rest of this preview breaks down the spread, total, matchup details, injuries, and props so the betting angle stays tied to the likely game script, and if you are comparing books before locking anything in, our top sportsbooks for NBA odds guide is a useful place to compare books before you bet.

NBA odds and lines for San Antonio Spurs at Detroit Pistons
If you are scanning the away side quickly, start with a clear form line: last-five ATS: 4-1-0, then layer in fresh detail from average margin: 98. The widget below will update late, so treat NBA odds for San Antonio Spurs as your main page for a quick check-in.
Detroit Pistons sets the tone with a game-shaped profile: last-five ATS: 5-0-0 plus a distinct indicator in last-five over-under: 2-3-0. If you want a home-first reference without extra clicks, NBA odds for Detroit Pistons stays clear and current.
 -118
-118 
 1.5 -105
Spurs at Pistons Rest Edge, Travel Load & Schedule Strength
Days since last game reads level (2 vs 2), which tilts the tiebreak to travel and last-7 pace. The previous-opponent line points to a tougher test for Detroit Pistons (41.4 vs 20.7), and that can lift the standard for carryover.
The games-in-7 row comes back flat at 0 vs 0, making it a smaller driver on its own. San Antonio Spurs shows the bigger immediate movement figure (1163.7 vs 238.9), and that tax can hit timing first, then decision-making when possessions tighten. Last-7 mileage is steady (0 vs 0), so the cumulative travel picture is not a separator.
| Metric | San Antonio Spurs | Detroit Pistons |
|---|---|---|
| Days since last game | 2 | 2 |
| Rest advantage vs opponent | 0 | 0 |
| Travel miles since last game | 1163.7 | 238.9 |
| Games in last 7 days | 0 | 0 |
| Time zone changes | 0 | 0 |
| Miles travelled last 7 days | 0 | 0 |
| Schedule strength | 61.2 | 61.2 |
| Remaining schedule strength | — | — |
| Previous opponent strength (win %) | 20.7 | 41.4 |
| Next opponent strength (win %) | 76.4 | 71.4 |
 New Users – Bet $5 Get $50 in Bet Reset Tokens for 7 Days
 San Antonio Spurs vs Detroit Pistons Quarter Splits: 1Q to 4Q and Halves
Think of quarter splits as a show pinpoint for scoring timing; a quick market reference is today’s NBA odds. On the away side, a quick glance says: best quarter is 1Q, and its stronger half is the first half. On the home side, a another check says: peaks in 2Q with the edge in the first half.
| Segment | Away | Home |
|---|---|---|
| 1Q Points | 31.4 | 29.7 |
| 2Q Points | 30.1 | 30.9 |
| 3Q Points | 29 | 28.7 |
| 4Q Points | 27.9 | 28.1 |
| 1H Points | 61.5 | 60.6 |
| 2H Points | 56.8 | 56.7 |
Season Profile Comparison: San Antonio Spurs vs Detroit Pistons
These tables are grouped to make the season profile easier to scan. Each category is anchored to two key stats, since that’s usually where you can tell which side has the cleaner path if the game follows form.
Record & Scoring
Win% favors Detroit Pistons (77.5), but point margin leans to San Antonio Spurs (8.3), which can signal a sturdier scoring baseline for San Antonio Spurs. If the pace is controlled, point margin often becomes the better guide because it reflects how teams handle the middle eight minutes of each half.
| Metric | San Antonio Spurs | Detroit Pistons |
|---|---|---|
| Record (W-L) | 62-20 | 60-22 |
| Win Percentage | 70.7 | 77.5 |
| Points For | 119.8 | 117.8 |
| Points Against | 111.5 | 109.6 |
| Points Margin | 8.3 | 8.2 |
Efficiency
San Antonio Spurs comes in ahead on shooting efficiency (110.4) and field goal efficiency (55.9), which is a strong read for shot-making stability. If Detroit Pistons can’t force tougher looks, that edge tends to show up across the middle quarters.
| Metric | San Antonio Spurs | Detroit Pistons |
|---|---|---|
| Field Goal % | 0.7 | 0.7 |
| Three-Point % | 0.2 | 0.2 |
| Shooting Efficiency | 110.4 | 107.2 |
| Field Goal Efficiency | 55.9 | 54.6 |
| Free Throw Rate | 0.3 | 0.3 |
| Three-Point Rate | 0.4 | 0.3 |
| Free Throw % | 0.8 | 0.8 |
Tempo, Ratings & Turnovers
San Antonio Spurs leads net rating (8.1 vs 7.6) and also plays cleaner by turnovers per game (12.6 vs 14.2). That combo usually means fewer “gift” possessions, which makes it easier to keep control even if pace rises.
| Metric | San Antonio Spurs | Detroit Pistons |
|---|---|---|
| Pace | 102.5 | 102.3 |
| Net Rating | 8.1 | 7.6 |
| Offensive Rating | 116.6 | 114.3 |
| Defensive Rating | 108.5 | 106.6 |
| Turnovers Per Game | 12.6 | 14.2 |
Rebounding, Ball Movement & Disruption
With offensive boards and steals near even (0.3/0.3, 7.5/10.4), the edge becomes about finishing possessions—secure rebounds, smart outlets, and clean first passes. One short run created by two mistakes is often enough to win the section.
| Metric | San Antonio Spurs | Detroit Pistons |
|---|---|---|
| Rebounds Per Game | 47 | 45.6 |
| Offensive Rebounds | 0.3 | 0.3 |
| Defensive Rebounds | 0.8 | 0.7 |
| Assists Per Game | 28.1 | 27.8 |
| Assist Rate | 64.6 | 64.1 |
| Steals Per Game | 7.5 | 10.4 |
| Blocks Per Game | 5.5 | 6.4 |
For a quick check, visit NBA odds to compare updated lines. A simple refresh can flag where the market is moving.
San Antonio Spurs at Detroit Pistons Head-to-Head History
The latest head-to-head meeting is a handy marker: Spurs claimed 123-95, by 28. The series rows below outline the broader picture where numbers exist.
| Item | Value |
|---|---|
| Last meeting score | 123-95 |
| Last meeting winner | Spurs |
| Last meeting margin | 28 |
| Side | Meetings | Wins | Losses | Average margin | Total points | ATS record | Over/Under record |
|---|---|---|---|---|---|---|---|
| Away | 2 | 1 | 1 | -8.6 | 223 | 0-0-0 | 0-0-0 |
| Home | 2 | 1 | 1 | 8.6 | 223 | 0-0-0 | 0-0-0 |
San Antonio Spurs at Detroit Pistons Key Players by Usage%: Top 3 Per Team
The top usage workload in this matchup sits with Victor Wembanyama (San Antonio Spurs), and the table below links that to production and efficiency. Their brief summary: Min 29, Usage% 32.6, 25 PPG, 11.5 RPG, 3.1 APG, TS% 62.6, eFG% 56.9, +/- 10.7, and TO/G 2.4.
San Antonio Spurs’s top three are Victor Wembanyama (32.6), Riley Minix (31.8), and De'Aaron Fox (25.1), and Detroit Pistons’s top three are Cade Cunningham (30.8), Jalen Duren (23.8), and Daniss Jenkins (21.7), and this list shows how creation is distributed. A more tight top line usually means heavier on-ball responsibility for the primary option, while a even top three can signal more shared creation and easier rotation coverage if one piece is limited.
For a short look at the award market, see the current MVP board. Start with our NBA MVP betting odds and sort the names.
| Team | Player | Min | Usage% | PPG | RPG | APG | TS% | eFG% | +/- | TO/G |
|---|---|---|---|---|---|---|---|---|---|---|
| San Antonio Spurs | Victor Wembanyama | 29 | 32.6 | 25 | 11.5 | 3.1 | 62.6 | 56.9 | 10.7 | 2.4 |
| San Antonio Spurs | Riley Minix | 3 | 31.8 | 3 | 0.7 | 0.3 | 75 | 75 | 4.3 | 0 |
| San Antonio Spurs | De'Aaron Fox | 31 | 25.1 | 18.6 | 3.8 | 6.2 | 57.8 | 54.9 | 6.3 | 2.3 |
| Detroit Pistons | Cade Cunningham | 34 | 30.8 | 23.9 | 5.5 | 9.9 | 56.4 | 51.3 | 8.1 | 3.7 |
| Detroit Pistons | Jalen Duren | 28 | 23.8 | 19.5 | 10.5 | 2 | 68.8 | 65 | 6.9 | 1.9 |
| Detroit Pistons | Daniss Jenkins | 20 | 21.7 | 9.3 | 2.3 | 3.9 | 52.5 | 47.3 | 2.9 | 1.6 |
 Spend $10 Get 200 in Bonus Picks
 San Antonio Spurs vs Detroit Pistons Prediction and Betting Outlook
- Game script (pace): San Antonio Spurs tends to press tempo off misses, while Detroit Pistons prefers to steady it into longer half-court possessions. The initial pace read frequently follows how the total plays.
- Efficiency edge (side): From a season lens, it tilts toward San Antonio Spurs when the possession script is tidier and second chances are limited. A few added possessions can turn it.
- Late filters (availability + market): Lineup news and situational context are the last gate, and they can shift how both teams score late in the clock. If money has moved the line, treat it as a cue to verify rather than pushing a lean.
-

Lonestar's Evoplay Cup Returns With a 50,000 Free SC Prize Pool
-

Sidepot Is Now an App, and It Comes With 1 Free SC
-

TheBoss Boosts Your First Play: 20,000 GC + 20 Free SC for $7.99
-

Most Improved Big 12 Teams in 2026: Cowboys Look For Massive Turnaround
-
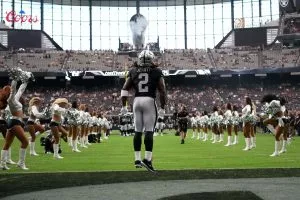
Las Vegas Raiders Avoid Disaster With Ashton Jeanty Injury
-

MLB Pitcher Props for Aug. 24: Cade Cavalli Mows Down the Rockies