College Football 2023 Preseason Strength Of Schedule Rankings
One of the most useful season-long college football handicapping tools is strength of schedule rankings. A team can be as good as they want, but if they play a gauntlet of a schedule, their win totals are going to be lower and division futures are going to be longer. Given the nature of college football, teams from select conferences and divisions play tougher schedules annually. Which teams play the most difficult schedules this season? The easiest?
Scroll to the bottom of the article for complete strength of schedule rankings for 2023. Rankings were assembled using the average power rating of their opponents, pulled from aggregate preseason power ratings including SP+, FPI, and more. Only games against FBS opponents were counted.
Check out 2023 college football national championship odds here.
Most Difficult College Football Strength Of Schedule
| TEAM | TOTAL AVG | HOME AVG | AWAY AVG |
| South Carolina | 35.0 | 30.5 | 39.5 |
| Florida | 34.6 | 33.3 | 35.9 |
| Missouri | 34.3 | 33.7 | 34.8 |
| Ole Miss | 33.7 | 25.5 | 42.0 |
| LSU | 33.1 | 27.4 | 38.7 |
| West Virginia | 32.9 | 30.3 | 35.5 |
| Alabama | 32.9 | 29.1 | 36.3 |
| Iowa State | 32.6 | 35.2 | 30.0 |
| Indiana | 32.6 | 27.7 | 37.5 |
| Michigan State | 32.5 | 33.7 | 31.3 |
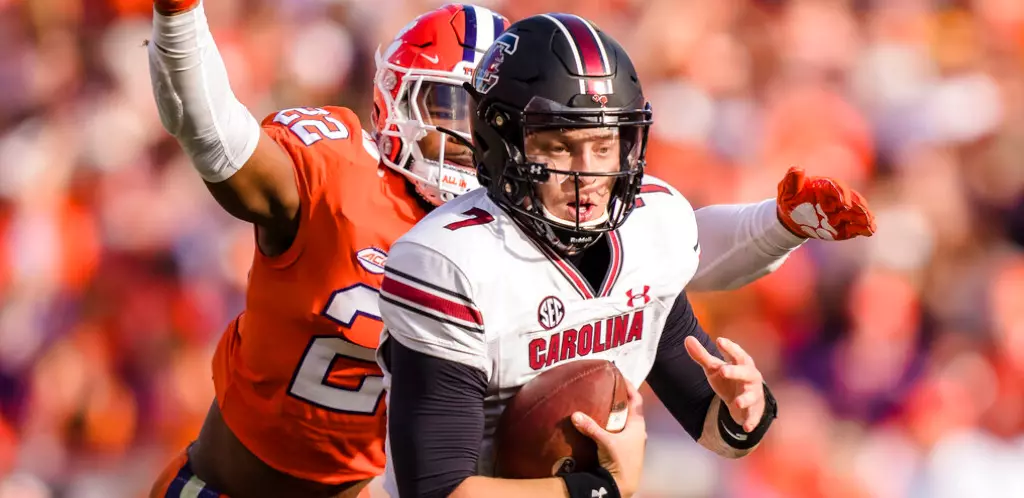
There's a few common denominators among these teams: Alabama, Georgia, Texas, Ohio State, or some combination of those four. South Carolina plays the most difficult schedule based on preseason rankings. The Gamecocks annually draw Georgia playing in the SEC East and play an annual rivalry game with Clemson, making them a frequenter near the top of SoS rankings. This season, they add a border rivalry with North Carolina and pull Texas A&M and Mississippi State cross-division.
While South Carolina plays the most difficult all-around schedule, Ole Miss plays the most difficult road schedule. That road draw includes both Alabama and Georgia, which account for the bulk of the rating. However, they also travel to Tulane – defending Cotton Bowl champions returning 71% of their roster – and handle their annual rivalry against Mississippi State in Starkville.
Aside from their usual SEC West schedule, Alabama hosts Texas and plays the most difficult home schedule. Typically, Georgia, Alabama, Ohio State, and the likes feature "easier" strength of schedules because they can't play themselves. Not the case for the Tide, who host the Longhorns as well as Ole Miss, Tennessee, and LSU.
When assessing win totals, difficult road schedules are more consequential to losses. If a team is going to play a gauntlet, it's better to handle at home than on the road. Ole Miss, Arkansas, South Carolina, LSU, and Indiana play the five most difficult road schedules this season.
- Continue the discussion on TheLines FREE Discord server with over 4,300 sports betting fans!
Easiest Schedules In the Nation
| TEAM | TOTAL AVG | HOME AVG | AWAY AVG |
| Liberty | 10.3 | 7.9 | 12.7 |
| New Mexico State | 10.9 | 8.6 | 13.2 |
| Toledo | 11.5 | 11.7 | 11.2 |
| Eastern Michigan | 11.5 | 5.5 | 17.6 |
| Miami (OH) | 11.9 | 10.3 | 13.4 |
| Ohio | 12.3 | 13.9 | 10.8 |
| New Mexico | 12.8 | 8.4 | 17.2 |
| Air Force | 13.0 | 13.2 | 12.8 |
| Northern Illinois | 13.2 | 12.6 | 13.8 |
| Akron | 13.3 | 11.3 | 15.2 |
| UTEP | 13.3 | 13.5 | 13.3 |
Again, some common denominators here – Conference-USA and the MAC are the weakest conferences and teams playing those conference foes will have the weakest SoS. New C-USA member Liberty benefits from the nation's easiest schedule, per preseason power ratings. In their first year under Jamey Chadwell, the Flames play non-conference games with Bowling Green (128th in ratings), Buffalo (96th), Old Dominion (115th), and UMass (127th). In total, eight of their 12 opponents rank lower than 100th.
Eastern Michigan plays the easiest home schedule in the country by a comfortable margin. Their highest-rated home opponent is Ball State, who ranks a paltry 114th in aggregate ratings, and FCS Howard. The Eagles have an outlier game at Minnesota, but face three more road opponents ranked lower than 100th. They finished last season with nine wins, including a bowl victory, and return nearly 80% of their defensive production this season.
Colorado State draws the easiest road tilt of the season, but has a disproportionately difficult home schedule. In a rare instance, the Rams host two Power Five programs, Washington State and Utah. They visit the second-lowest rated P5 program (Colorado) and four of five remaining road opponents rank outside the top 100 in power ratings.
College Football Strength Of Schedule Ranking
| TEAM | RK | HOME AVG | AWAY AVG | TOTAL AVG |
| South Carolina | 1 | 30.5 | 39.5 | 35.0 |
| Florida | 2 | 33.3 | 35.9 | 34.6 |
| Missouri | 3 | 33.7 | 34.8 | 34.3 |
| Ole Miss | 4 | 25.5 | 42.0 | 33.7 |
| LSU | 5 | 27.4 | 38.7 | 33.1 |
| West Virginia | 6 | 30.3 | 35.5 | 32.9 |
| Alabama | 7 | 36.3 | 29.1 | 32.7 |
| Iowa State | 8 | 35.2 | 30.0 | 32.6 |
| Indiana | 9 | 27.7 | 37.5 | 32.6 |
| Michigan State | 10 | 33.7 | 31.3 | 32.5 |
| Arkansas | 11 | 23.4 | 41.2 | 32.3 |
| Kentucky | 12 | 29.2 | 35.3 | 32.2 |
| Tennessee | 13 | 27.1 | 36.8 | 31.9 |
| Kansas State | 14 | 30.9 | 32.9 | 31.9 |
| Ohio State | 15 | 32.9 | 30.9 | 31.9 |
| California | 16 | 32.0 | 31.8 | 31.9 |
| Texas Tech | 17 | 35.4 | 28.2 | 31.8 |
| Texas A&M | 18 | 26.2 | 37.1 | 31.7 |
| Arizona State | 19 | 28.0 | 35.2 | 31.6 |
| Baylor | 20 | 28.2 | 34.7 | 31.5 |
| Rutgers | 21 | 26.0 | 36.9 | 31.5 |
| BYU | 22 | 29.0 | 33.8 | 31.4 |
| Mississippi State | 23 | 29.8 | 32.6 | 31.2 |
| Vanderbilt | 24 | 30.2 | 31.6 | 30.9 |
| Utah | 25 | 27.2 | 34.1 | 30.6 |
| Auburn | 26 | 30.8 | 30.4 | 30.6 |
| Kansas | 27 | 33.0 | 28.2 | 30.6 |
| Minnesota | 28 | 29.1 | 32.0 | 30.5 |
| Purdue | 29 | 32.5 | 28.5 | 30.5 |
| TCU | 30 | 27.2 | 33.4 | 30.3 |
| Texas | 31 | 24.1 | 36.4 | 30.2 |
| Notre Dame | 32 | 30.2 | 29.9 | 30.0 |
| Colorado | 33 | 24.3 | 34.7 | 29.5 |
| Pittsburgh | 34 | 30.5 | 28.3 | 29.4 |
| Georgia Tech | 35 | 28.1 | 30.2 | 29.2 |
| Northwestern | 36 | 30.7 | 27.0 | 28.8 |
| Clemson | 37 | 29.7 | 28.0 | 28.8 |
| UCF | 38 | 25.4 | 32.1 | 28.8 |
| Oklahoma State | 39 | 30.0 | 27.3 | 28.7 |
| North Carolina | 40 | 26.3 | 30.7 | 28.5 |
| Washington | 41 | 28.4 | 28.5 | 28.5 |
| Cincinnati | 42 | 28.2 | 28.6 | 28.4 |
| Illinois | 43 | 25.3 | 31.2 | 28.3 |
| Georgia | 44 | 26.2 | 30.3 | 28.2 |
| Stanford | 45 | 33.1 | 23.0 | 28.0 |
| Penn State | 46 | 24.2 | 31.7 | 28.0 |
| Maryland | 47 | 28.6 | 26.9 | 27.8 |
| Duke | 48 | 29.0 | 26.4 | 27.7 |
| Arizona | 49 | 30.0 | 25.2 | 27.6 |
| Wake Forest | 50 | 28.0 | 27.2 | 27.6 |
| Virginia | 51 | 24.1 | 31.0 | 27.6 |
| Oklahoma | 52 | 29.2 | 25.7 | 27.4 |
| Michigan | 53 | 21.5 | 33.4 | 27.4 |
| Oregon State | 54 | 30.0 | 24.3 | 27.1 |
| Houston | 55 | 30.4 | 23.9 | 27.1 |
| Oregon | 56 | 23.1 | 30.8 | 27.0 |
| Florida State | 57 | 22.6 | 30.8 | 26.7 |
| Wisconsin | 58 | 24.0 | 28.9 | 26.4 |
| Miami (FL) | 59 | 26.7 | 25.9 | 26.3 |
| Nebraska | 60 | 25.0 | 27.6 | 26.3 |
| Iowa | 61 | 22.5 | 30.0 | 26.2 |
| NC State | 62 | 32.0 | 20.4 | 26.2 |
| Syracuse | 63 | 24.6 | 27.6 | 26.1 |
| USC | 64 | 24.9 | 26.7 | 25.8 |
| Washington State | 65 | 23.1 | 27.8 | 25.5 |
| Louisville | 66 | 25.5 | 25.3 | 25.4 |
| Virginia Tech | 67 | 25.9 | 24.4 | 25.1 |
| UCLA | 68 | 19.8 | 29.1 | 24.4 |
| Boston College | 69 | 19.5 | 26.2 | 22.9 |
| UAB | 70 | 17.0 | 27.0 | 22.0 |
| East Carolina | 71 | 20.2 | 22.7 | 21.5 |
| Rice | 72 | 21.8 | 19.8 | 20.8 |
| Florida Atlantic | 73 | 22.2 | 18.8 | 20.5 |
| Southern Miss | 74 | 16.1 | 24.6 | 20.4 |
| Tulane | 75 | 22.4 | 17.3 | 19.9 |
| Tulsa | 76 | 15.5 | 24.0 | 19.8 |
| Louisiana-Monroe | 77 | 18.7 | 20.8 | 19.8 |
| Navy | 78 | 17.9 | 21.6 | 19.7 |
| Army | 79 | 14.4 | 25.0 | 19.7 |
| Charlotte | 80 | 16.3 | 22.9 | 19.6 |
| UTSA | 81 | 13.3 | 25.7 | 19.5 |
| Old Dominion | 82 | 19.9 | 18.3 | 19.1 |
| USF | 83 | 18.4 | 19.7 | 19.0 |
| North Texas | 84 | 21.2 | 16.6 | 18.9 |
| Georgia State | 85 | 19.9 | 17.8 | 18.9 |
| Boise State | 86 | 16.5 | 21.0 | 18.7 |
| Memphis | 87 | 22.4 | 14.6 | 18.5 |
| Wyoming | 88 | 14.7 | 22.1 | 18.4 |
| San Diego State | 89 | 19.7 | 16.9 | 18.3 |
| SMU | 90 | 12.7 | 23.9 | 18.3 |
| South Alabama | 91 | 14.9 | 21.3 | 18.1 |
| San Jose State | 92 | 19.6 | 16.1 | 17.9 |
| Troy | 93 | 19.5 | 16.2 | 17.9 |
| Temple | 94 | 20.7 | 15.0 | 17.8 |
| Arkansas State | 95 | 17.1 | 18.3 | 17.7 |
| Marshall | 96 | 14.6 | 20.2 | 17.4 |
| Utah State | 97 | 18.0 | 16.3 | 17.2 |
| Texas State | 98 | 14.5 | 19.7 | 17.1 |
| Coastal Carolina | 99 | 17.1 | 17.1 | 17.1 |
| Appalachian State | 100 | 17.5 | 16.1 | 16.8 |
| Ball State | 101 | 12.6 | 20.5 | 16.6 |
| UConn | 102 | 14.9 | 17.8 | 16.4 |
| Florida International | 103 | 17.0 | 15.3 | 16.2 |
| Middle Tennessee | 104 | 8.3 | 23.6 | 15.9 |
| James Madison | 105 | 14.1 | 17.7 | 15.9 |
| Georgia Southern | 106 | 12.4 | 19.3 | 15.9 |
| UMass | 107 | 9.2 | 22.3 | 15.7 |
| Western Michigan | 108 | 9.3 | 22.1 | 15.7 |
| Western Kentucky | 109 | 12.1 | 18.8 | 15.5 |
| Central Michigan | 110 | 11.0 | 19.6 | 15.3 |
| Louisiana | 111 | 10.7 | 19.7 | 15.2 |
| Bowling Green | 112 | 11.8 | 18.5 | 15.2 |
| Louisiana Tech | 113 | 11.8 | 18.3 | 15.1 |
| UNLV | 114 | 10.6 | 19.4 | 15.0 |
| Colorado State | 115 | 20.4 | 9.3 | 14.8 |
| Sam Houston State | 116 | 11.3 | 17.9 | 14.6 |
| Hawaii | 117 | 14.1 | 14.8 | 14.5 |
| Kent State | 118 | 9.7 | 18.9 | 14.3 |
| Buffalo | 119 | 12.4 | 16.1 | 14.2 |
| Nevada | 120 | 10.4 | 17.8 | 14.1 |
| Jacksonville State | 121 | 14.4 | 13.3 | 13.8 |
| Fresno State | 122 | 10.1 | 17.4 | 13.7 |
| UTEP | 123 | 13.2 | 13.5 | 13.3 |
| Akron | 124 | 11.3 | 15.2 | 13.3 |
| Northern Illinois | 125 | 12.6 | 13.8 | 13.2 |
| Air Force | 126 | 12.8 | 13.2 | 13.0 |
| New Mexico | 127 | 8.4 | 17.2 | 12.8 |
| Ohio | 128 | 13.9 | 10.8 | 12.3 |
| Miami (OH) | 129 | 10.3 | 13.4 | 11.9 |
| Eastern Michigan | 130 | 5.5 | 17.6 | 11.5 |
| Toledo | 131 | 11.7 | 11.2 | 11.5 |
| New Mexico State | 132 | 8.6 | 13.2 | 10.9 |
| Liberty | 133 | 7.9 | 12.7 | 10.3 |
-

MLB Today’s Best Bets for 07/26: Home Run Picks & Top Player Props
-

Third County Places Indiana Casino Vote on November Ballot
-

Kentavious Caldwell-Pope Could Join LeBron James, 76ers After Buyout
-

Prediction Markets News Today 7/25: LeBron James, Netflix Movie
-
Patrick Mahomes Fully Cleared as Chiefs Open Training Camp
-

I Checked Out LoneStar's iPhone 17 Pro Giveaway - Here's How to Enter